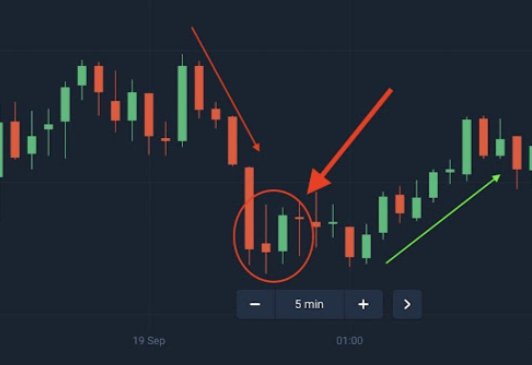

Candlestick charts distill price action into individual bars that show open, high, low, and close for a set interval. Each candle’s body reflects the net move, with wicks exposing intraperiod extremes. Color or shading indicates whether the close surpassed the open. Aggregating candles reveals momentum, volatility, and potential support or resistance zones. Understanding these signals helps define entry, exit, and risk parameters, but the next step requires testing assumptions against market structure and timing. Thus, the conversation continues with practical application.
Why Candlesticks Matter for Crypto Trading
Candlestick charts matter in crypto trading because they compactly summarize price action across a chosen time frame, revealing open, high, low, and close in a single visual.
They support risk management by highlighting volatility and entry/exit points, while clarifying market psychology through candlestick patterns.
This systematic view enables disciplined decision-making, aligning traders with objective, freedom-oriented analysis and risk-aware strategies.
Read OHLC in Crypto Candlesticks
Understanding OHLC data is essential for interpreting crypto candles: the open, high, low, and close within a selected interval reveal price action, volatility, and intra-period dynamics. Read OHLC readings to gauge immediate market sentiment, identify intraday ranges, and quantify liquidity dynamics. Analysts interpret comparative bars across sessions to validate trends, assess order flow implications, and align risk parameters with evolving price action.
Spotting Key Candlestick Patterns
In the wake of interpreting OHLC data, analysts identify recurring formations that signal potential price moves. Spotting key candlestick patterns relies on concise recognition of bullish and bearish signals, balancing body size, shadows, and context. Pattern psychology explains trader expectations, while volume confirmation strengthens validity. The observer notes pattern reliability, noting confirmations from prior price behavior and market momentum without overinterpreting single candles.
Choosing Timeframes for Your Crypto Strategy
Choosing Timeframes for a Crypto Strategy requires aligning horizon, volatility, and trade frequency with the analyst’s objectives. Timeframe selection should assess timeframe sensitivity, balancing short-term responsiveness with longer-term trend clarity. Analysts apply volatility scaling to position sizing and risk controls, ensuring that chart granularity matches liquidity and objective. The result is disciplined, objective-driven framing of entry, exit, and risk thresholds.
See also: How Bitcoin Wallets Store and Manage Digital Assets
Conclusion
Candlestick charts distill price action into actionable signals for crypto traders. Read OHLC data quickly, assessing momentum, volatility, and potential reversals within each interval. Spotting patterns like engulfing or doji helps frame entry and risk controls across timeframes. While no single candle guarantees direction, a disciplined, analyst-oriented approach—combining pattern recognition with volume and trend context—improves odds. In essence, candlesticks are a compass: they point, yet require prudent interpretation to avoid misdirection.